
The Update That Made Quack-Mate Slower: DuckDB 1.5 -> 2.0
When a faster database makes your application slower — and why

Almost from the moment I started building Quack-Mate, I held one comforting belief about its design. In the original write-up I described it as a deliberate separation of concerns: JavaScript orchestrates the search, and DuckDB does 100% of the heavy lifting — all the move generation, validation, evaluation, and minimax back-propagation live in SQL, expressed as relational operations.
That boundary felt like a promise. If the logic lives in the data-access layer as standard SQL, then the application’s performance is, to a large degree, the database’s performance. Improve the database, and the application improves for free. You don’t touch a line of chess code. You just upgrade the engine underneath it.
So when DuckDB 2.0 landed, the plan was genuinely as lazy as it sounds: run npm update, and Quack-Mate gets faster. The release notes were full of reasons to believe it. A new SQL parser. A rewritten recursive-CTE engine that DuckDB claimed was ~40× faster on a reachability benchmark. Aggregations that spill to disk. Faster storage. In most of the ways that matter to an analytical engine, 2.0 is a straightforwardly better DuckDB.
The Benchmark: npm update, and… slower
Nothing about the setup changed except the driver version. Same 1.5.2 versus 2.0.0 @duckdb/node-api, same machine, same Quack-Mate source, depth 4, single thread, four standard Perft positions, the same cumulative ladder of heuristics culminating in + LMR.
Here is KiwiPete (Board 3) — a highly tactical position, the kind the engine cares about most:
| Config | Move | Nodes | Time 1.5.2 (ms) | Time 2.0.0 (ms) | RSS 1.5.2 (MB) | RSS 2.0.0 (MB) |
|---|---|---|---|---|---|---|
| Recursive (Exhaustive) | e2a6 | 4,185,553 | 83,406 | 100,487 | 11,674 | 39,777 |
| ID (Exhaustive) | e2a6 | 4,287,636 | 53,502 | 40,953 | 11,635 | 6,460 |
| BPVS (ID + AB + LMP + Batches) | e2a6 | ~125K | 4,615 | 6,444 | 1,723 | 1,717 |
| + MVVLVA | e2a6 | ~28K | 2,902 | 4,858 | 1,404 | 1,540 |
| + TT | e2a6 | ~26K | 2,838 | 4,894 | 1,404 | 1,540 |
| + PST | e2a6 | 26,464 | 2,905 | 5,075 | 1,403 | 1,776 |
| + Killers | e2a6 | 26,466 | 2,770 | 5,108 | 1,400 | 1,584 |
| + History | e2a6 | 26,464 | 3,053 | 4,988 | 1,400 | 1,575 |
| + RFP | e2a6 | 16,275 | 2,884 | 4,920 | 1,375 | 1,528 |
| + FFP | e2a6 | 14,775 | 2,723 | 5,343 | 1,383 | 1,553 |
| + LMR | e2a6 | 14,775 | 2,501 | 4,896 | 1,374 | 1,528 |
| JS DFS Reference | e2a6 | 2,195 | 121 | 110 | 1,097 | 1,300 |
Two things jump out immediately. First, the SQL configurations are almost uniformly ~1.4–2× slower on 2.0 while choosing the same moves and scores as 1.5.2 — same search, up to twice the clock. Second, the JS DFS Reference row is essentially unchanged (121 ms -> 110 ms). That row is our control: it’s a pure JavaScript port that never touches DuckDB. Its stability proves the machine and the harness are fine — the regression is entirely inside DuckDB itself.
The other boards tell the same story, with two telling exceptions:
- Board 1 (Start) and Board 4 (Endgame) — small trees — the single-query
Recursive (Exhaustive)strategy is actually faster on 2.0 (4,649 -> 3,830 ms and 1,312 -> 1,165 ms). - Board 2 (Complex Mid-game) and Board 3 (KiwiPete) — large trees —
Recursive (Exhaustive)is slower on 2.0, and its memory explodes (Board 2: 10.9 GB -> 33.3 GB; Board 3: 11.7 GB -> 39.8 GB).
So “2.0 is slower” isn’t quite right. It’s worse for the heavy cases and better for the small ones — a scale-dependent split that turned out to be the key to the whole mystery.
The Investigation: where did the time actually go?
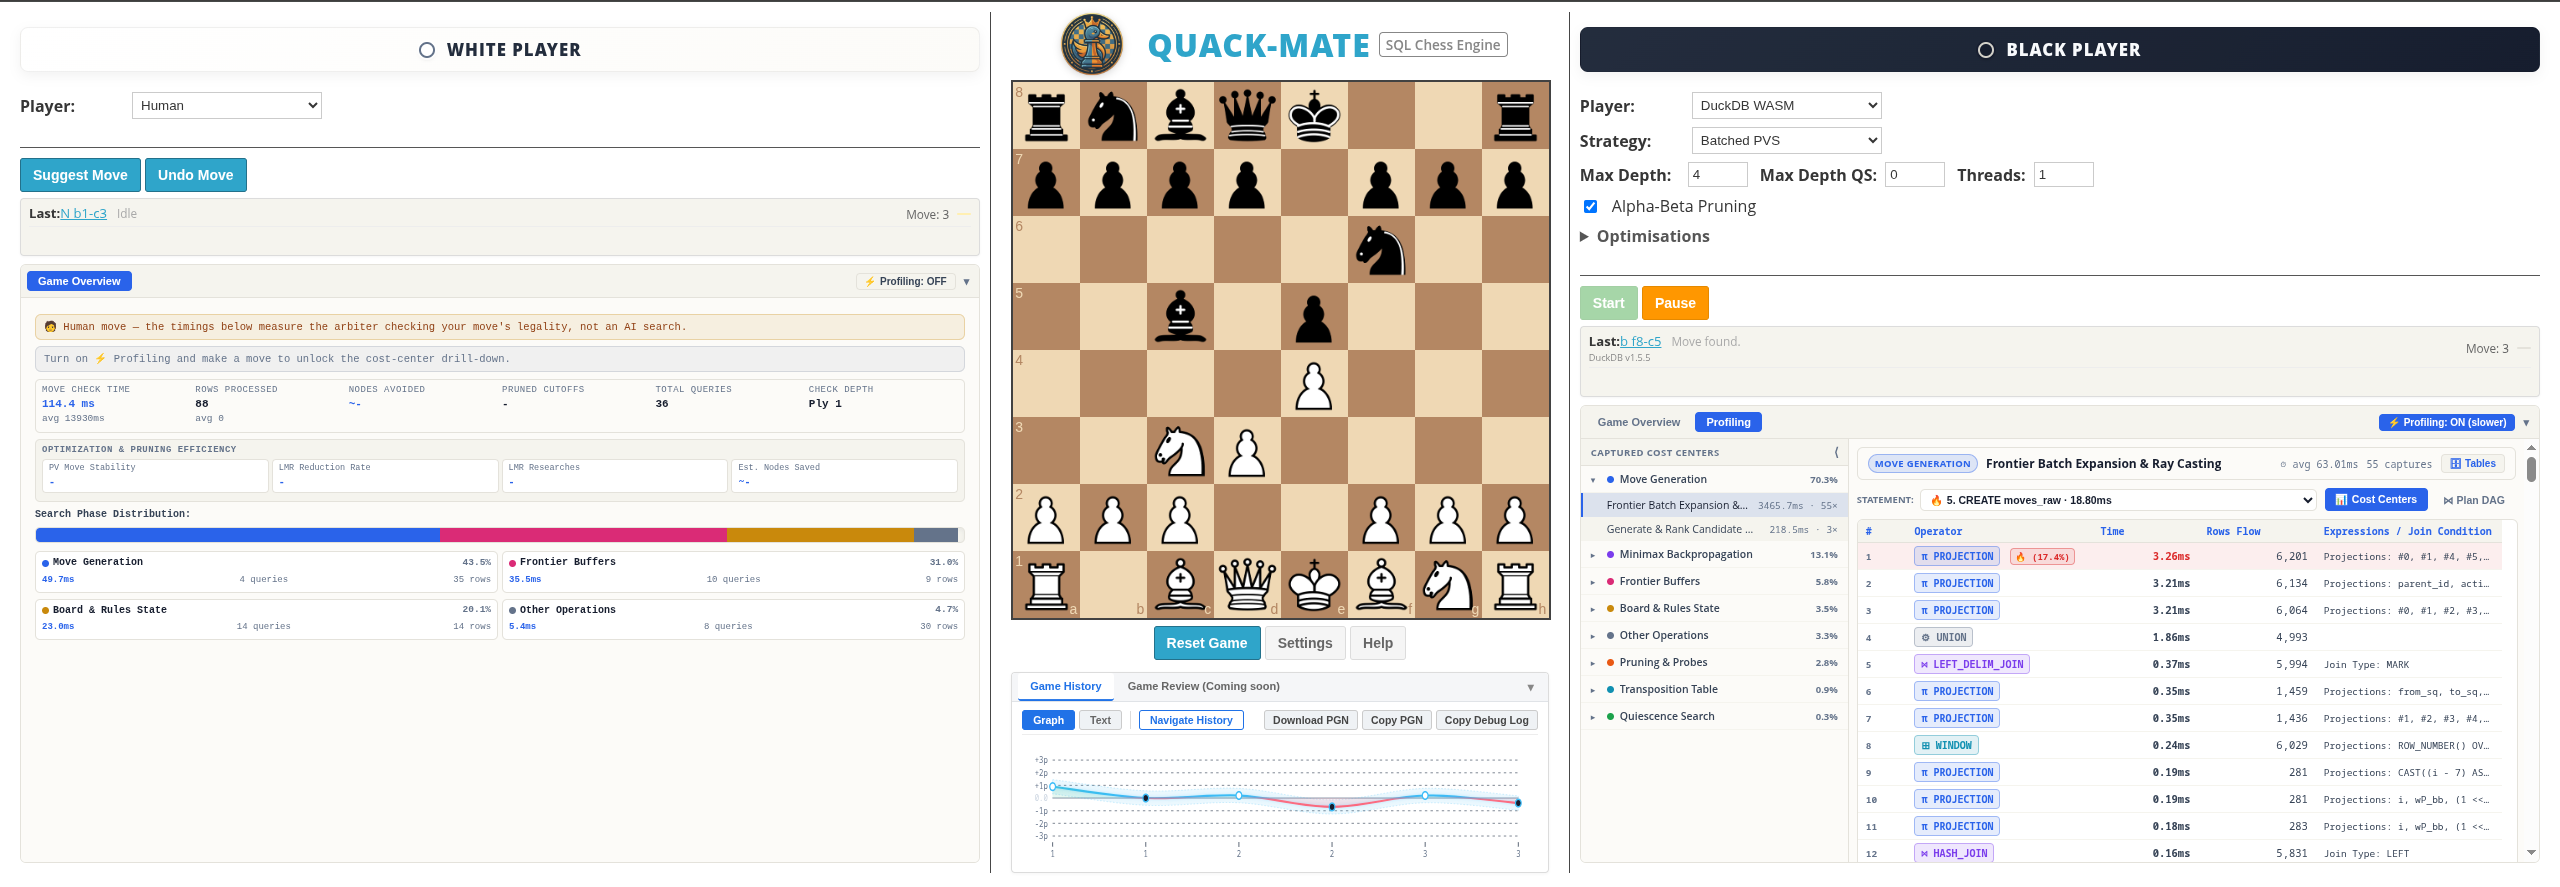
Quack-Mate already ships a profiler (the UI exposes the exact SQL and DuckDB’s native operator plan), so the next step was to point it at the + LMR configuration on KiwiPete at depth 4 and ask DuckDB where its time went. That required one small fix first: DuckDB 2.0 changed the JSON profiler schema (from a flat set of fields to nested parser / planner / optimizer / operator objects), so the existing profile parser silently reported zeros for 2.0. After normalizing both layouts, the picture was unambiguous.
The surprising part is what dominates. + LMR on KiwiPete at depth 4 issues ~810 SQL statements — of which only one is the big move-generation query and the rest are short frontier/pruning/minimax steps. Aggregate time across the whole move, 1.5.2 versus 2.0 (these are profiler-enabled runs: profiling adds roughly a millisecond per statement, so the absolute wall here sits above the unprofiled + LMR benchmark row — compare the split, not the totals):
| Component | 1.5.2 | 2.0.0 |
|---|---|---|
| Operator CPU (execution) | ~1,500 ms | ~1,590 ms |
| Optimizer | ~850 ms | ~1,910 ms |
| Planner | ~880 ms | ~2,770 ms |
| Parser | not reported | ~1,410 ms |
Execution — the actual relational crunching of moves, checks, and scores — is essentially unchanged (~1,500 → ~1,590 ms). What changed is compilation: parsing, planning, and optimization each grew sharply. (These are profiler stage totals, averaged over three runs; they overlap and do not partition the query’s runtime — the execution figure alone sums every operator along the pipeline — so compare them stage by stage rather than summing.) On 1.5.2, where parsing isn’t even reported separately, planning and optimization together were only ~1.7 s.
Per statement, the arithmetic is stark:
| Per SQL statement | 1.5.2 | 2.0.0 |
|---|---|---|
| Execution | ~1.8 ms | ~1.9 ms |
| Optimizer | ~1.0 ms | ~2.4 ms |
| Planner | ~1.1 ms | ~3.4 ms |
| Parser | — | ~1.7 ms |
A few milliseconds per query is nothing for one query. Multiplied across ~800 queries per move, that per-query compilation overhead is what drives the slowdown.
Root cause #1: the “chatty” workload
This is the granularity paradox from the original post coming back around, wearing a new hat. BPVS is deliberately chatty: to keep alpha-beta pruning intelligent, it fires hundreds of sequential “micro-queries” rather than one big scan. In 1.5.2 the per-query compilation overhead was modest — comparable to the actual chess computation itself. In 2.0, it grew.
Part of it is a deliberate, headline feature. From the 2.0 announcement:
“DuckDB has always used a parser derived from PostgreSQL’s. In 2.0, our own modern, extensible PEG-based parser … becomes the default.”
The new parser is genuinely better engineering — it allows extensions to hook into the grammar and produces far better error messages. But it is more expensive per parse, and Quack-Mate pays that cost ~800 times per move: in the profiler, parsing is ~1.4 s of a KiwiPete move under the PEG parser.
Out of curiosity I re-ran the same profiled KiwiPete setup with the legacy parser enabled (SET enable_legacy_parser = true;). It does what you’d hope: parsing drops from ~1.4 s to ~0.2 s, saving roughly a second of the move’s wall time. But the planner (~2.8 s) and optimizer (~1.9 s) are untouched — and those are where 2.0’s extra cost actually lives.
Which is the important nuance: the 2.0 parser cost is not the whole story. Even with the cheapest parser, 2.0’s planner and optimizer are ~2–3× more expensive per statement than 1.5.2’s. For Quack-Mate’s workload that’s the dominant term.
💡 Could we just prepare the statements? (Short answer: no.)
The obvious idea is to PREPARE the BPVS statements so their plans are reused. I tested it, and it doesn’t do what you’d want for two reasons.
First, DuckDB 2.0 re-runs the planner and optimizer on every execution of a prepared statement, even a parameterless one. Measured per-execution profile, prepared vs raw on 2.0:
raw SQL             : parser=0.17 planner=0.20 optimizer=0.28
prepared (no param) : parser=0.00 planner=0.23 optimizer=0.25
The parser is skipped; the planner and optimizer are not. On 1.5.2 a parameterless prepared statement caches the plan outright (planner=0, optimizer=0), a behaviour 2.0 no longer has — and as soon as you bind parameters (which you must, for the depth/alpha/beta values that change every batch), both versions re-plan anyway.
Second, Quack-Mate’s expansion SQL isn’t even a fixed string: depth, batch_id, the alpha/beta window, and the temp-table names are all interpolated into the query text, and the query shape changes when pruning is active. As the original post notes, those thresholds are injected as hardcoded literals on purpose — the optimizer needs them as constants to push the pruning filters down. Parameterizing them would defeat that.
So preparing would buy back the parser and the per-call statement setup, and nothing more. It’s a partial mitigation, not a cure.
Root cause #2: the rewritten recursive CTE
BPVS isn’t the only strategy Quack-Mate has. The original single-query Recursive (Exhaustive) engine runs the entire search as one WITH RECURSIVE — one query, not eight hundred. So the “chatty workload” explanation can’t apply to it. Yet on the big boards it got slower (Board 2: 72.4 s -> 79.5 s; Board 3: 83.4 s -> 100.5 s) and used dramatically more memory (Board 3: 11.7 GB -> 39.8 GB).
The reason is that DuckDB 2.0 rewrote its recursive-CTE engine, and the physical plan is genuinely different. Dumping the operator tree for the same recursive query on the same position:
1.5.2 — correlated references streamed through delimiter joins:
REC_CTE
  └─ LEFT_DELIM_JOIN -> LEFT_DELIM_JOIN -> … -> DELIM_SCAN
2.0.0 — the same references materialized into CTEs and re-scanned:
RECURSIVE_CTE
  └─ CTE -> CTE_SCAN -> CTE -> CTE_SCAN -> …
The operator names swap cleanly: REC_CTE + DELIM_JOIN/DELIM_SCAN becomes RECURSIVE_CTE + CTE/CTE_SCAN. Quack-Mate’s recursive term is full of correlated subqueries — the Zobrist hash, the PST sum, the ep-square and castling logic — and 2.0 materializes those into CTEs and scans them back instead of streaming them. Materialization is exactly what inflates memory.
This is where DuckDB’s own claims get interesting, because the follow-up post on the rewrite is not wrong — it just describes a different workload. The new engine’s headline win is that it retains recursion-independent state across epochs instead of rebuilding it every iteration. But retention requires a proof of repeatability:
“We retain a build only when its observable result is repeatable … a volatile expression such as
nextval()… must be rebuilt.”
Quack-Mate’s recursive term literally uses nextval('seq_search_tree_id'), and its heaviest subqueries are frontier-dependent (they read the current board), so those builds are exactly the ones the new engine declines to retain. But retention is only one half of the rewrite. The other half is reusable executors and precomputed pipeline schedules: the old runtime, in DuckDB’s words, “treated each epoch as a fresh execution: it recreated events and executors, reconstructed operator state and repeated scheduling work”, while the new engine carries that machinery across epochs. That improvement applies to any recursion, Quack-Mate’s included. So Quack-Mate isn’t purely worse off — it misses the retention win, but it still gets the cheaper per-epoch execution, while paying the new plan’s materialization cost. (DuckDB’s own post is candid that the rewrite isn’t a universal win: a 5.5% geomean across their recursive suite, with a documented ~6% regression case of its own.)
And that balance is exactly what produces the scale split. At depth 3, 2.0 genuinely does less work: the recursive query runs in 2,984 ms versus 3,685 ms, and the old plan’s single biggest cost — a FILTER sweep over ~54 million rows (2.1 s) — collapses to ~0.1 s, because the engine now materializes that work once as a CTE instead of re-evaluating it per frontier row. That same materialization, though, already costs more memory (1,011 MB vs 669 MB peak at depth 3). Scale up to depth 4 and the footprint reaches nearly 40 GB; there, the memory traffic and pressure from the materialization finally outweigh the per-epoch savings, and the result flips to slower.
But DuckDB 2.0 really is faster
I want to be careful here, because one may read all this as “DuckDB 2.0 is slower”, and that’s simply false. 2.0 is faster in most of the ways that matter to an analytical database:
- Their reachability microbenchmark on a one-million-edge graph dropped from 4.05 s to 0.095 s — a claimed 42.6× — for an unchanged recursive query.
USING KEYrecursion and keyed pathfinding saw huge wins (an LDBC SF100 query going 19.3 s -> 2.9 s and using less memory).- Storage, aggregation spilling, partitioning, and async I/O all improved.
Quack-Mate is simply an unusual workload: it’s a “small data” engine built on a “big data” database. Alpha-beta pruning means every step touches only tens of rows, so per-query overhead — not per-row throughput — is the entire cost structure. The original post already identified this (“relational overhead is fixed per query, regardless of how few rows are processed”). DuckDB 2.0 tuned itself for large scans and cleaner recursion; Quack-Mate’s ~800-tiny-queries-per-move pattern and its volatile, correlated recursive CTE sit outside the sweet spot. When per-query overhead rises even slightly and you run a thousand of them, “slightly” becomes “twice as slow”.
The lesson: the abstraction boundary leaks
The reason this stung was the design promise from the original post. If chess logic is just standard SQL over a clean data-access layer, then swapping the database should be a transparent win — improve the engine, improve the app, change nothing else.
And structurally, that promise held. I changed zero lines of chess code. The regression appeared purely as a database-version difference, and it was fully diagnosable using the database’s own profiler and query plans. The logic/data-access boundary did exactly what it was supposed to.
But the boundary did not make performance opaque. Per-query compilation cost and memory behaviour are architectural properties of the engine — they leak straight through the abstraction and into wall-clock time, and they leak hardest for chatty workloads. “Just update the database” is a reliable promise for throughput-bound work and a fragile one for overhead-bound work. A chess engine that fires hundreds of micro-queries per move is, unavoidably, in the second category.
So for now, Quack-Mate is staying on the 1.5.x line, where the numbers are simply better. That’s a slightly less satisfying outcome than “I updated a dependency and everything got faster” — but it’s a far more interesting one, and it’s a good reminder that the cleanest architectural boundary in the world still can’t fully hide the physics underneath it.
 Play Quack-Mate Online